
Overview
See your Unique visitors, current Members, and estimated MRR (monthly recurring revenue), along with your latest and recent published articles. Article cards show website visitors for the selected period and email performance across the article’s lifetime. Open an article’s analytics for more detail.Overview article open rates use sent recipients as the denominator, with recorded email activity used when send counts are missing. The Newsletters tab uses delivered emails, so the rates can differ.
Web traffic
- Unique visitors — Visitors recorded during the selected period.
- Total views — Page views, including repeat views.
- Top content — Articles and pages ranked by visitor count, including your homepage.
- Top sources — Where visitors found your website, ranked by visitors.
- Top locations — Visitors grouped by country.
Visitor counts are estimates, not a count of identified people. Someone returning on another day or using another device can count again. See how our analytics provider counts visitors.
Newsletters
Email subscribers counts current members subscribed to at least one newsletter. Someone subscribed to several newsletters counts once.Open and click rates
The Newsletters tab calculates:
For example, if an article is delivered to 100 recipients and 40 open it, its open rate is 40%. Repeated opens or clicks by the same recipient on the same article count once within the period. That recipient can count again for a different article.
The overall rates combine activity across articles; they aren’t a simple average of individual article percentages. Rates are rounded to whole percentages, and show 0% when no deliveries are recorded.
Date ranges filter when deliveries, opens, and clicks happened—not when the article was sent. An open today can relate to an email delivered before the selected period. Daily and period rates can therefore look unusual, or exceed 100% when opens or clicks outnumber recorded deliveries in that period.
Top newsletters
This table shows up to ten emailed articles with deliveries recorded in the selected period, alongside their open and click rates. Despite the heading, entries are ordered by article date, newest first, rather than ranked by engagement. The Sent column currently counts recorded deliveries within the selected period.Members
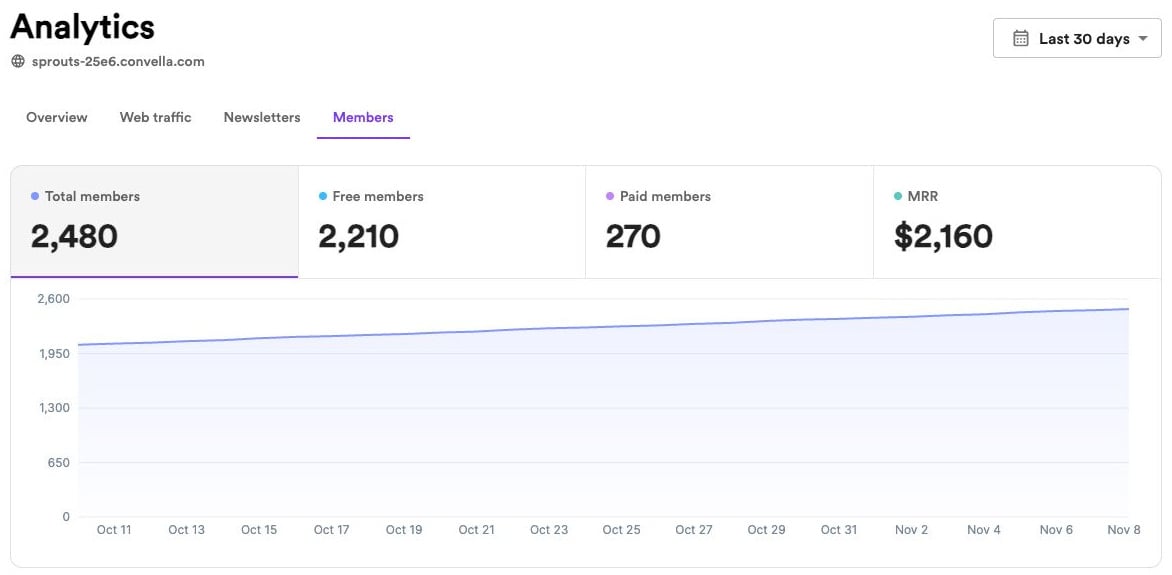
- Total members — All current members of your website, whether or not they receive newsletters.
- Free members — Members without current access to paid content.
- Paid members — Members with active paid-content access, including trials and unexpired complimentary subscriptions.
- MRR — Estimated monthly recurring revenue from active, non-complimentary subscriptions. Trials don’t contribute revenue.
How MRR is calculated
MRR adds each active subscription’s monthly equivalent. A monthly subscription contributes its monthly price; an annual subscription contributes its annual price divided by 12. For example, a $120 annual subscription** contributes **$10 MRR. This is a price-based estimate, not payments collected or payouts received. Discounts, refunds, taxes, and processing fees aren’t incorporated. If a subscription’s price can’t be resolved, it is excluded and the dashboard displays a notice.Recent growth
See new members, current paid conversions, and their estimated MRR impact by date. Trials and complimentary subscriptions can count as new paid access but add no MRR.Member and revenue trends are reconstructed from current records and their creation dates. They aren’t a complete historical ledger: deleted members, past cancellations, and historical price or membership changes aren’t preserved in these trends.
Date ranges
Use the selector in the top-right corner to choose Last 7 days, Last 30 days, Last 90 days, Year to date, Last 12 months, or All time. The default is Last 30 days.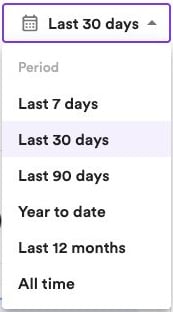
Member, email-subscriber, and MRR totals describe your current audience and subscriptions. The date selector changes the displayed trends and activity, not those current totals. Email-subscriber trends use current subscriptions and member join dates, rather than a history of newsletter opt-ins and unsubscribes.